·
2 minute read
·
2 minute read
In sales, speed matters. Momentum built in discovery and demos should carry straight through to the proposal stage. Yet for many sales teams, that is exactly where deals stall.
Proposals linger in draft form. Approvals crawl through inboxes. AEs spend hours formatting instead of selling. And while your team waits, your buyers lose interest or competitors swoop in with faster responses.
The result is not just inefficiency. It is lost deals. Every extra day a proposal sits, your win rate drops.
The Real Cost of Proposal Friction
- 30% of AE time is lost to non-selling work¹
- In a 40 hour week, that is 12 hours per rep
- For a 10 rep team, that is 120 hours per week lost
At a $150K OTE (about $72 per hour), that equates to $8,640 per week or $34,560 per month of wasted selling capacity.
That is budget you are already paying for with minimal return.
The Big Impact: Pipeline Velocity and Win Rates
Proposal delays do more than wait on deals. They slow your revenue engine:- Deals stuck in the proposal stage beyond 21 days are 70% less likely to close²
- B2B companies with shorter sales cycles of 30 to 45 days achieve up to 38% higher sales velocity³
- Lost momentum after demos often pushes deals into the next quarter, bloating the pipeline
Quick Self Check: Rate Your Proposal Health
You might be leaking pipeline if:
- Reps still pull from old decks
- Proposal creation involves three or more tools
- Approvals get trapped in inboxes
- No one owns the proposal workflow end to end
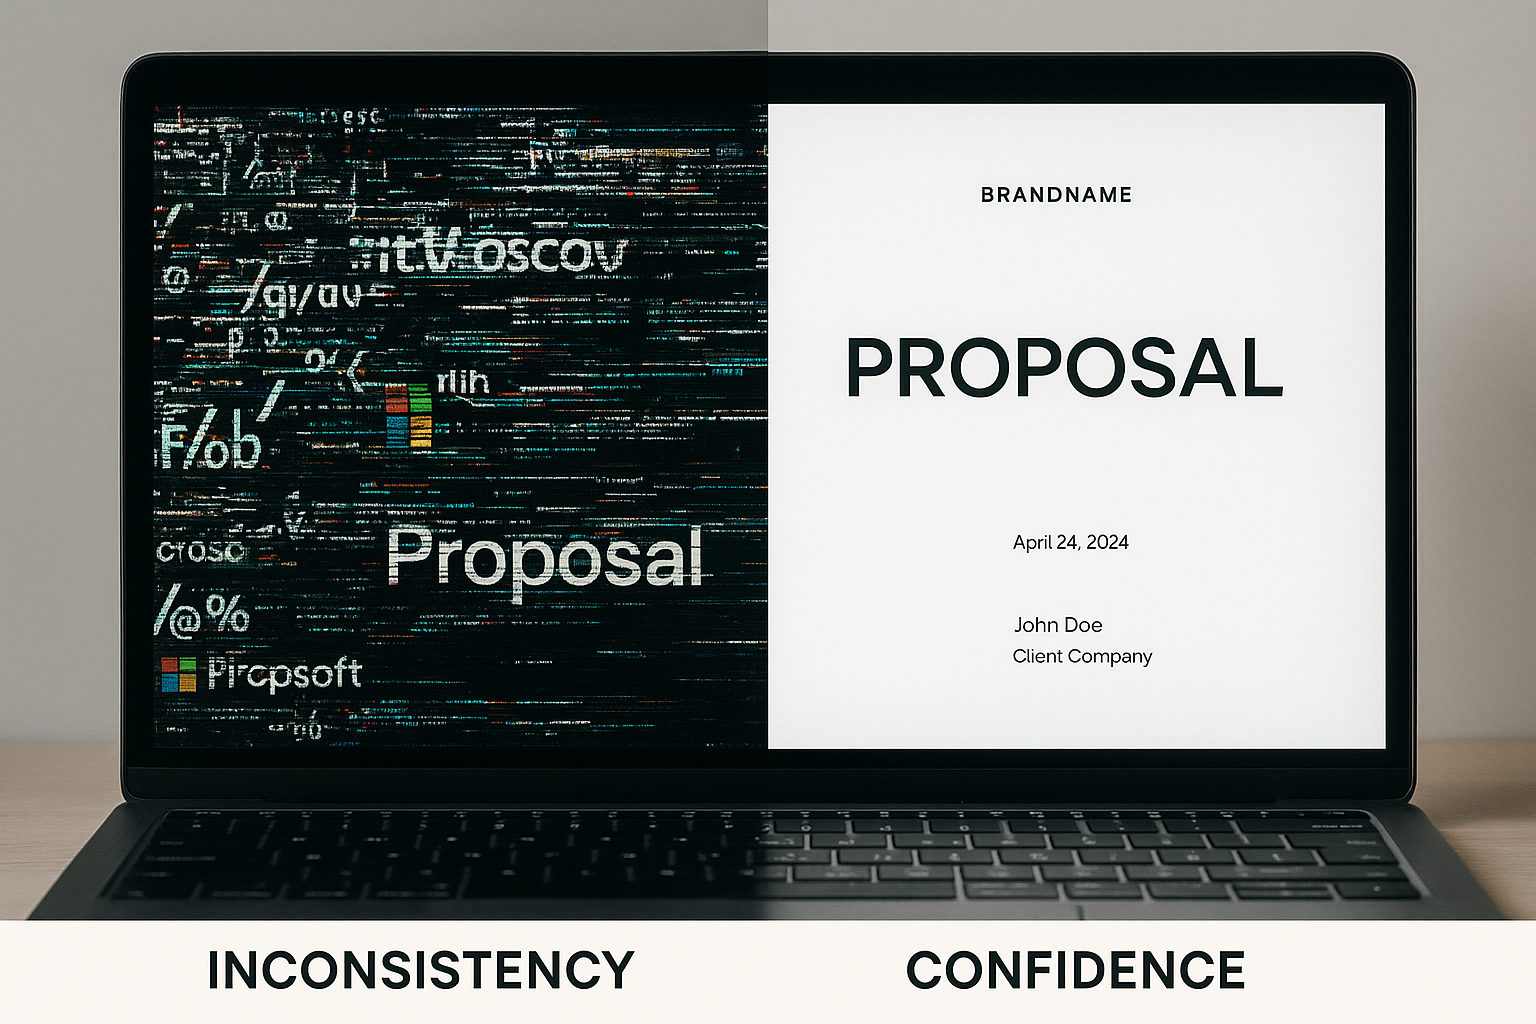
What Orchestration Looks Like at Scale
Enablement is not about adding more tools. It is about running the proposal flow for your reps.
Here is how orchestration works:
- CRM driven prompts auto fill content, pricing, and terms
- Real time approval flows eliminate email delays
- Built in version control ensures compliance
- Dashboards spotlight cycle time and bottlenecks
This is not a template. It is reclaiming your team’s bandwidth.
A Sales Velocity Lens
Here is why proposal delays matter more than time lost.
Sales velocity = (Opportunities × Deal Value × Win Rate) ÷ Cycle Length
Baseline Scenario:
- 100 active opportunities
- $50K average deal size
- 25% win rate
- 90 day sales cycle
Velocity = $1.39M per month
With a 14 day proposal delay (104 day cycle):
- Velocity = $1.20M per month
Shortening cycle time boosts velocity even if deal value and win rate stay static.
The Revenue Compounding Effect
When proposals go from hours to minutes:
- Reps spend more time selling
- Offers land when buyers are most engaged
- Win rates climb, cycles shrink, and forecasts sharpen
This is not incremental. It compounds quarter over quarter.
Quick Start Guide: Start Accelerating Now
- Track AE proposal time for 2 weeks
- Calculate lost velocity using the formula
- Map your ideal orchestration flow
- Set a new KPI: proposal cycle time or time in stage
Because while you are manually crafting one proposal, a competitor might already be closing the deal.
Talewind helps you stop revenue leakage before it derails your forecast.
¹ LinkedIn. State of Sales Report 2022 — sales professionals spend less than one third of their time selling. Link² Forecastio. How To Calculate Win Rate in Just a Few Steps, 2025 — deals in proposal stage beyond 21 days are 70% less likely to close. Link
³ First Page Sage. Sales Pipeline Velocity Metrics, 2025 — shorter sales cycles of 30 to 45 days yield up to 38% higher velocity. Link